
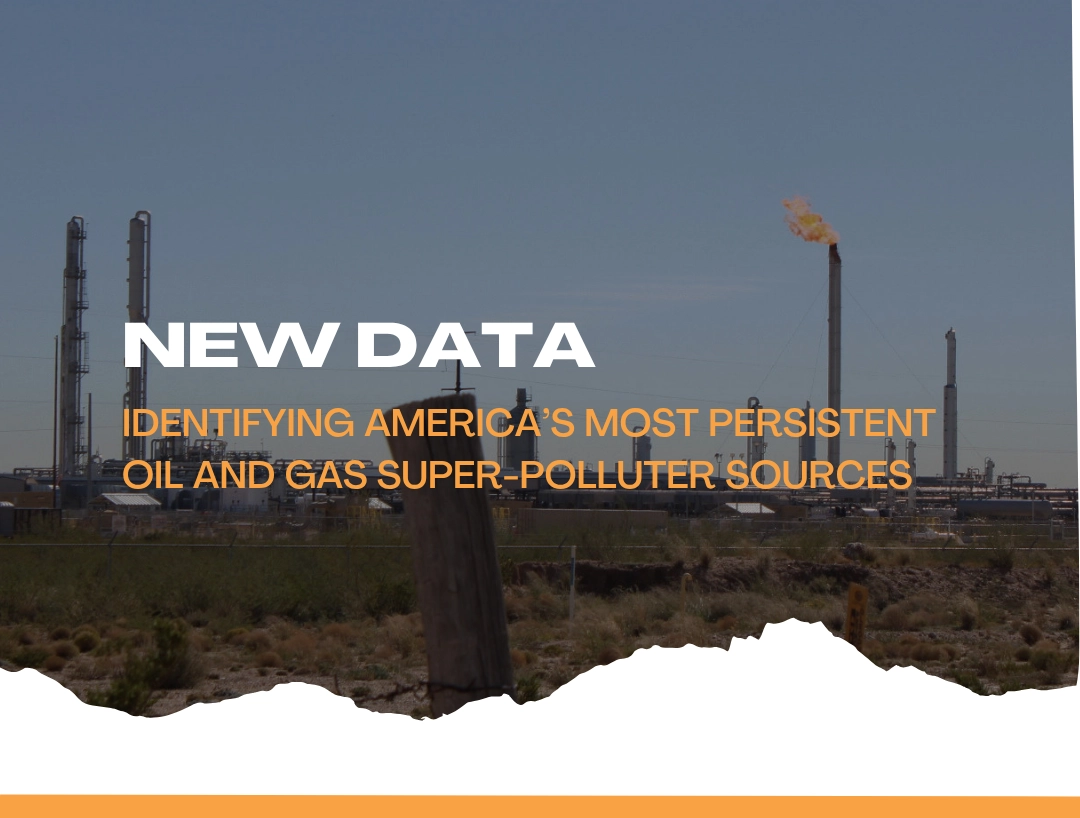
On October 27, 2026, the Environmental Protection Agency released its plan to eliminate federal rules limiting methane air pollution from oil and gas companies.
Numerous persistent polluting facilities, operated by some of America’s most profitable companies, illustrate exactly why federal rules like the EPA’s Super-Emitter Program were developed and remain necessary for protecting public health.
Super-Persistent Super-Polluting Operations near Shreveport
Approximately 40 miles southeast of Shreveport and six miles south of Ringgold, Louisiana, the Woodardville Hall Summit gas facility, operated by Adamas Energy, a wholly owned subsidiary of Mitsubishi Corporation (following its acquisition of Aethon Energy in 2026), has been observed by the Tanager-1 satellite eight times since the beginning of 2025. Super-polluting methane events were documented at this location on each occasion. Carbon Mapper calculated the methane emissions rates observed at this location from February 2025 through September 2026 averaged approximately 1,200 kilograms per hour.
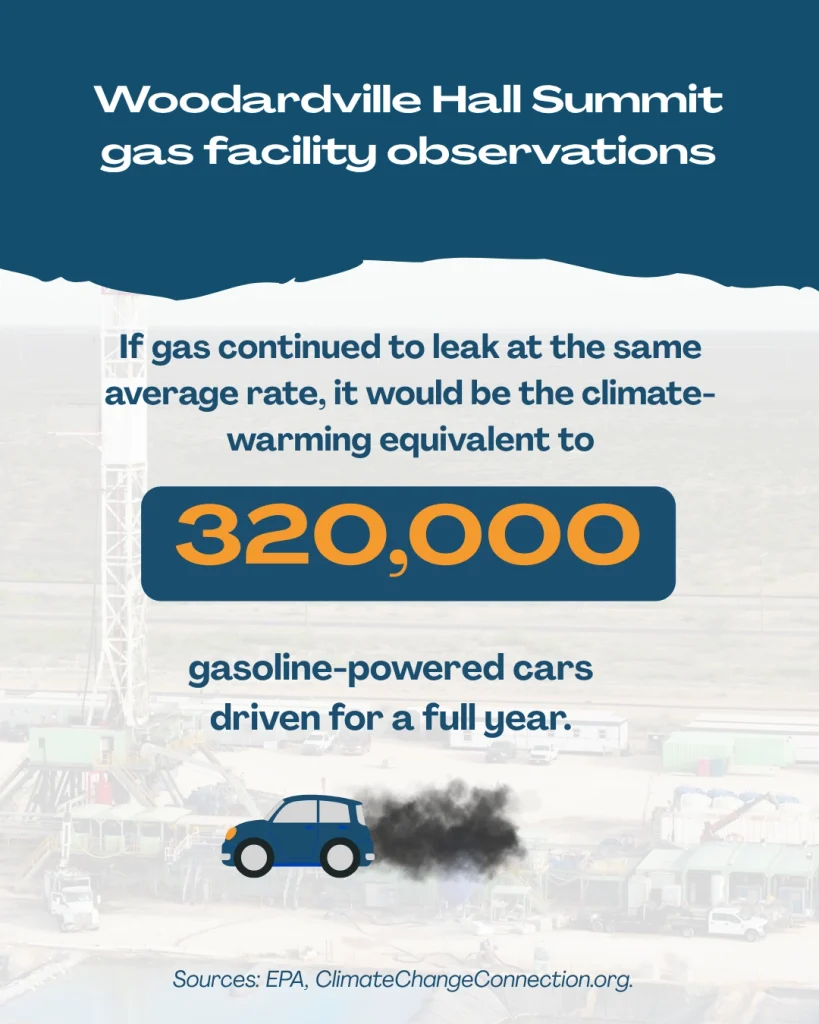
While satellite observation data effectively captures only single moments in time, the extreme persistence of emissions across numerous observations is a worrying sign of potentially continuous pollution. If gas continued to leak at that same average rate, it would amount to about 876 metric tons of methane lost into the atmosphere each month, adding up to about 17,500 tons over the past twenty months (February 2025 – September 2026), representing about $3 million in wasted gas at today’s wholesale prices and the climate-warming equivalent to 320,000 gasoline-powered passenger vehicles driven for a year.1
Unfortunately, this does not appear to be the only super-polluting facility in the region. About 12 miles to the west, Kinder Morgan’s KH Plantation Central Gas Treating Facility has been observed 12 times since July 31, 2025 by the Tanager-1 satellite, with super-polluting methane events documented each time. From July 2025 through September 2026, Carbon Mapper calculated the methane emissions rates observed at this location averaged approximately 818 kilograms per hour. If gas likewise continued to leak at that same average rate, it would amount to about 597 metric tons of additional methane lost into the atmosphere each month, adding up to about 8,360 tons over the past fourteen months (August 2025 – September 2026), representing about $1.4 million in wasted gas at today’s wholesale prices and the climate-warming equivalent to more than 150,000 gasoline-powered passenger vehicles driven for a year.
Super-Polluters near Laredo in Texas’ Eagle Ford
Since January 2025, satellite data from Carbon Mapper reveals more than 200 super-polluter events from oil and gas facilities in Texas’ Eagle Ford Basin. From this data, one particularly persistent source stands out.
Approximately 30 miles northeast of the center of Laredo and 10 miles south of Encinal, Texas, a gas facility has been observed by satellite on six different days, with super-polluting methane events documented on each occasion. Carbon Mapper calculated the methane emissions rate averaged approximately 630 kilograms per hour across all of these observations. If gas continued leaking at that same average rate since the first observation on February 24, 2025 through September 2026, it would amount to about 460 metric tons of lost methane each month and about 8,700 tons over those nineteen months, representing about $1.5 million in wasted gas at today’s wholesale prices and the climate-warming equivalent to nearly 160,000 gasoline-powered passenger vehicles driven for a year. These observed methane plumes appear next to Dos Caminos’ Spears Facility (Dos Caminos, LLC is a joint venture of Kinder Morgan and Howard Energy Partners).
Dozens of Recent Plumes near Energy Transfer Facilities
Our coalition’s analysis has previously revealed numerous significant air pollution events and the companies behind them. In February 2026, for example, we examined Energy Transfer, one of the nation’s largest pipeline and energy infrastructure companies, identifying 43 methane plumes observed by satellite in 2025 near 25 of the company’s facilities. A report we recently released examining emissions data in New Mexico’s Permian Basin from January 2025 through April 2026 similarly points to Energy Transfer as one of the most chronic and widespread super-emitters operating in the region.
In light of the EPA’s recent rollback announcement, we reexamined satellite observational data for these Energy Transfer locations, finding 33 new super emitter observations in just the first nine months of 2026. These include:
| Location | Plume event link from Carbon Mapper | Date Acquired | Plume Emissions rate (kg CH4/hr) | Oberved Source Persistence (Jan – Sept 2026) | Nearby Facility |
|---|---|---|---|---|---|
| Stanton, Texas | Link | 9/15/2026 | [Not yet quantified] | 100% | Red Lake Gas Plant |
| Stanton, Texas | Link | 2/23/2026 | 643+/-219 | 100% | Red Lake Gas Plant |
| Stanton, Texas | Link | 1/14/2026 | 1.1K+/-0.5K | 100% | Red Lake Gas Plant |
| Coyanosa, Texas | Link | 8/27/2026 | 822+/-116 | 100% | Waha Header Compressor Station |
| Coyanosa, Texas | Link | 4/27/2026 | 706+/-140 | 100% | Waha Header Compressor Station |
| Loving, New Mexico | Link | 6/23/2026 | 1.1K+/-0.2K | 25% | Mosaic Compressor Station |
| Garden City, Texas | Link | 8/25/2026 | 445+/-91 | 33% | Rebel Gas Plant |
| Orla, Texas | Link | 9/17/2026 | [Not yet quantified] | 75% | Red Bluff plant |
| Orla, Texas | Link | 5/31/2026 | [Not yet quantified] | 75% | Red Bluff plant |
| Orla, Texas | Link | 4/22/2026 | [Not yet quantified] | 75% | Red Bluff plant |
| Orla, Texas | Link | 4/22/2026 | 365+/-99 | 75% | Red Bluff plant |
| Orla, Texas | Link | 9/17/2026 | [Not yet quantified] | 83% | Red Bluff Express Compressor Station |
| Orla, Texas | Link | 5/31/2026 | 260+/-92 | 83% | Red Bluff Express Compressor Station |
| Orla, Texas | Link | 5/22/2026 | 637+/-140 | 83% | Red Bluff Express Compressor Station |
| Orla, Texas | Link | 4/22/2026 | [Not yet quantified] | 83% | Red Bluff Express Compressor Station |
| Orla, Texas | Link | 4/20/2026 | 583+/-176 | 83% | Red Bluff Express Compressor Station |
| Garden City, Texas | Link | 8/25/2026 | 177+/-79 | 67% | Pemberton Booster Station |
| Garden City, Texas | Link | 3/9/2026 | 302+/-108 | 67% | Pemberton Booster Station |
| Garden City, Texas | Link | 2/28/2026 | 482+/-129 | 67% | Pemberton Booster Station |
| Garden City, Texas | Link | 1/19/2026 | 471+/-123 | 67% | Pemberton Booster Station |
| Laredo, Texas | Link | 3/26/2026 | 1.5K+/-0.1K | 33% | G2LT CDP |
| Laredo, Texas | Link | 3/14/2026 | 492+/-97 | 33% | G2LT CDP |
| Orla, Texas | Link | 9/16/2026 | [Not yet quantified] | 67% | Bear Gas Plant |
| Orla, Texas | Link | 5/31/2026 | 183+/-39 | 67% | Bear Gas Plant |
| Mentone, Texas | Link | 9/17/2026 | [Not yet quantified] | 40% | West Slash Compressor Station |
| Mentone, Texas | Link | 4/20/2026 | 414+/-116 | 40% | West Slash Compressor Station |
| Malaga, New Mexico | Link | 3/11/2026 | 926+/-209 | 20% | Avalon Compressor Station |
| Hobbs, New Mexico | Link | 9/3/2026 | 428+/-253 | 67% | WT-1 Compressor Station |
| Hobbs, New Mexico | Link | 3/11/2026 | 859+/-176 | 67% | WT-1 Compressor Station |
| Malaga, New Mexico | Link | 7/30/2026 | 279+/-65 | 50% | Willow Lake Gas Processing Plant |
| Malaga, New Mexico | Link | 6/23/2026 | [Not yet quantified] | 50% | Willow Lake Gas Processing Plant |
| Malaga, New Mexico | Link | 4/22/2026 | 5.4K+/-2.6K | 50% | Ross Draw Compressor Station |
| Malaga, New Mexico | Link | 3/11/2026 | 906+/-216 | 50% | Ross Draw Compressor Station |
While methane is invisible to the human eye, the high persistence at Energy Transfer’s Red Bluff Compressor Station shows the potential for huge emissions implications. Since April 20th, 2026, this location has been observed five times by the Tanager-1 satellite with emissions documented on each occasion. Carbon Mapper calculated the methane emissions rates observed at this location from April through September averaged approximately 494 kilograms per hour. If gas continued to leak at this average rate for those entire six months, it would amount to about 2,160 metric tons of methane lost into the atmosphere, representing nearly $750,000 in wasted gas at today’s wholesale prices and the climate-warming equivalent to more than 39,000 gasoline-powered passenger vehicles driven for a year.
Evidence of routine pollution events at midstream gas facilities doesn’t come only from the sky. Methane plumes were documented twice by satellite in 2025 at the location of Energy Transfer’s Carlsbad Gas Plant, about 3 miles southwest of Loving, New Mexico. In November 2025, Earthworks thermographers visited this area and observed a faulty flare releasing methane and volatile organic compounds (VOCs) in a volume large enough that it was visible through an optical gas imaging camera from over 4.5 miles away. When Earthworks returned in May 2026, methane and VOC emissions were documented again from the same flare at the same location.
- The methane emissions conversion estimate was calculated as follows: (17,500,000 [kg methane emitted] × 84 [20-year Global Warming potential of methane, Climate Change Connection]) / 4,600 [kg carbon dioxide equivalent emitted per passenger vehicle per year, EPA] = 319,565 [gasoline-powered passenger vehicles’ worth of annual emissions].
↩︎